
Visualize This
The Flowingdata Guide to Design, Visualization, and Statistics
Wiley · Print & ebook · May 29, 2024
One of the most influential data visualization books—updated with new techniques, technologies, and examples Visualize This demonstrates how to explain data visually, so that you can present and communicate information in a way that is appealing and easy to understand.
We earn from qualifying purchases.
- Who it’s for
- Explore data before designing visualizations, with tutorials, tools, examples, and practical design tips.
- Themes
- Data visualization, Statistical graphics and maps, Data storytelling
- Genres
- Data Viz, Data Mining, Math & Stats Software
Nearest books
Matched by what the books are about, then ordered by what their readers also loved. Most of these share its genres: Data Viz and Data Mining.
 Storytelling With DataCole Nussbaumer Knaflic75% match
 Persuading With DataMiro Kazakoff72% match
 The Big Book of DashboardsSteve Wexler, Jeffrey Shaffer63% match
 Avoiding Data PitfallsBen Jones63% match
 Gnuplot in ActionPhilipp K. Janert59% matchAlso shares Math & Stats Software
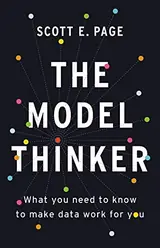 The Model ThinkerScott E. Page, Jamie Renell57% match
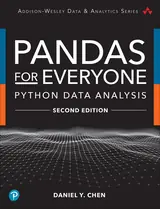 Pandas for EveryoneDaniel Y. Chen55% match
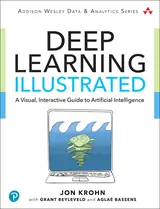 Deep Learning IllustratedJon Krohn, Grant Beyleveld55% match
For younger readers: Graphs!, Phenomenal Moments: Revealing the Hidden Science Around US
Start with three books, and this one can be the first.
Members get a new edition every morning: a route out from their books to essays, research and talks, with the reason for each.
Start with this bookAbout this book
One of the most influential data visualization books—updated with new techniques, technologies, and examples Visualize This demonstrates how to explain data visually, so that you can present and communicate information in a way that is appealing and easy to understand. Today, there is a continuous flow of data available to answer almost any question. Thoughtful charts, maps, and analysis can help us make sense of this data. But the data does not speak for itself.
Continue reading
As leading data expert Nathan Yau explains in this book, graphics provide little value unless they are built upon a firm understanding of the data behind them. Visualize This teaches you a data-first approach from a practical point of view. You'll start by exploring what your data has to say, and then you'll design visualizations that are both remarkable and meaningful. With this book, you'll discover what tools are available to you without becoming overwhelmed with options. You'll be exposed to a variety of software and code and jump right into real-world datasets so that you can learn visualization by doing. You'll learn to ask and answer questions with data, so that you can make charts that are both beautiful and useful. Visualize This also provides you with opportunities to apply what you learn to your own data. This completely updated, full-color second edition: - Presents a unique approach to visualizing and telling stories with data, from data visualization expert Nathan Yau - Offers step-by-step tutorials and practical design tips for creating statistical graphics, geographical maps, and information design - Details tools that can be used to visualize data graphics for reports, presentations, and stories, for the web or for print, with major updates for the latest R packages, Python libraries, JavaScript libraries, illustration software, and point-and-click applications - Contains numerous examples and descriptions of patterns and outliers and explains how to show them Information designers, analysts, journalists, statisticians, data scientists—as well as anyone studying for careers in these fields—will gain a valuable background in the concepts and techniques of data visualization, thanks to this legendary book.
Charts, Maps, and Data
Explore data before designing visualizations, with tutorials, tools, examples, and practical design tips.
Come here for
- A data-first approach to making charts and maps
- Practical design tips for statistical graphics and information design
Expect
- Step-by-step tutorials for statistical graphics, maps, and information design
- Examples of patterns and outliers, with ways to show them
Where it sits
| Data Viz | 100% |
|---|---|
| Data Mining | 56% |
| Math & Stats Software | 22% |
Percentages are BookFrontier’s reading of the book.
Publisher categories
- Data Mining
- Data Viz
- Authors
- Nathan Yau
- Publisher
- Wiley
- Published
- May 29, 2024
- Format
- Print & ebook
- Theme
- Data visualization · Statistical graphics and maps · Data storytelling
- Reading lane
- Data Mining